Capacity
Capacity types and how they are displayed in Open Electricity
Overview
Capacity refers to the maximum amount of electrical power that a generation unit can produce, typically measured in megawatts (MW). Understanding the different types of capacity measurements helps in analysing the true potential and operational constraints of electricity generators.
Types of Capacity
In the Australian electricity market, there are two primary capacity measurements tracked by AEMO (Australian Energy Market Operator):
Registered Capacity
Registered capacity represents the normal operational capacity of a generation unit. This is the capacity registered with AEMO for standard market operations.
- For solar farms, this typically reflects the aggregate capacity of all solar panels installed
- For fossil fuel plants, this often represents the design capacity or Maximum Continuous Rating
- This is the standard measure used for most capacity analysis
Maximum Capacity
Maximum capacity is used by AEMO for bid validation in market systems and may differ from registered capacity.
- For solar farms, this is often lower than registered capacity due to grid connection constraints
- For fossil fuel plants, this may represent a temporary higher output achievable at reduced efficiency
- This capacity might only be sustained for limited periods
Why Do These Capacities Differ?
The differences between registered and maximum capacity vary by generation technology:
Solar Farms often have registered capacity greater than maximum capacity due to:
- Intentional oversizing of solar panel installations
- Grid connection limitations that constrain output
- Economic optimisation considering varying solar conditions
Fossil Fuel Plants sometimes have maximum capacity greater than registered capacity because:
- They can temporarily operate above normal ratings
- Higher outputs may come with reduced efficiency
- Operators typically avoid this except during high-price events
It is worth noting these values can differ considerably and may have implications for analysis. Consider how solar farm capacity has varied with time.
On the y-axis we have the ratio of registered to maxium capacity, and it is evident many facilities have a much larger registered capacity. Consequently, it is important to keep in mind which capacity metric is used for a given purpose as they may yield meaningfully different results. This ratio for fossil fuels is often less dramatic, though the decision may still be important. Take the generation at a Bayswater unit (BW03).
BW03 had a registered capacity of 660MW during 2024, however for 2154 hours, or over 24% of the time, it averaged generation above this value, whilst other coal facilities will have a substantially different profile. For instance Eraring’s ER01 did not exceed its registered capacity for any hourly period in 2024, despite having a maximum capacity 30MW greater than its registered capacity.
For a detailed technical discussion of these capacity measures, see WattClarity’s analysis: Analytical Challenge – choosing what measure to use, for ‘Installed Capacity’
Accessing Capacity Data
Open Electricity provides capacity information through multiple interfaces:
Facility Pages
Individual facility pages display detailed capacity information. For example, the Bayswater Power Station page shows the unit’s capacity in its capacity chart:
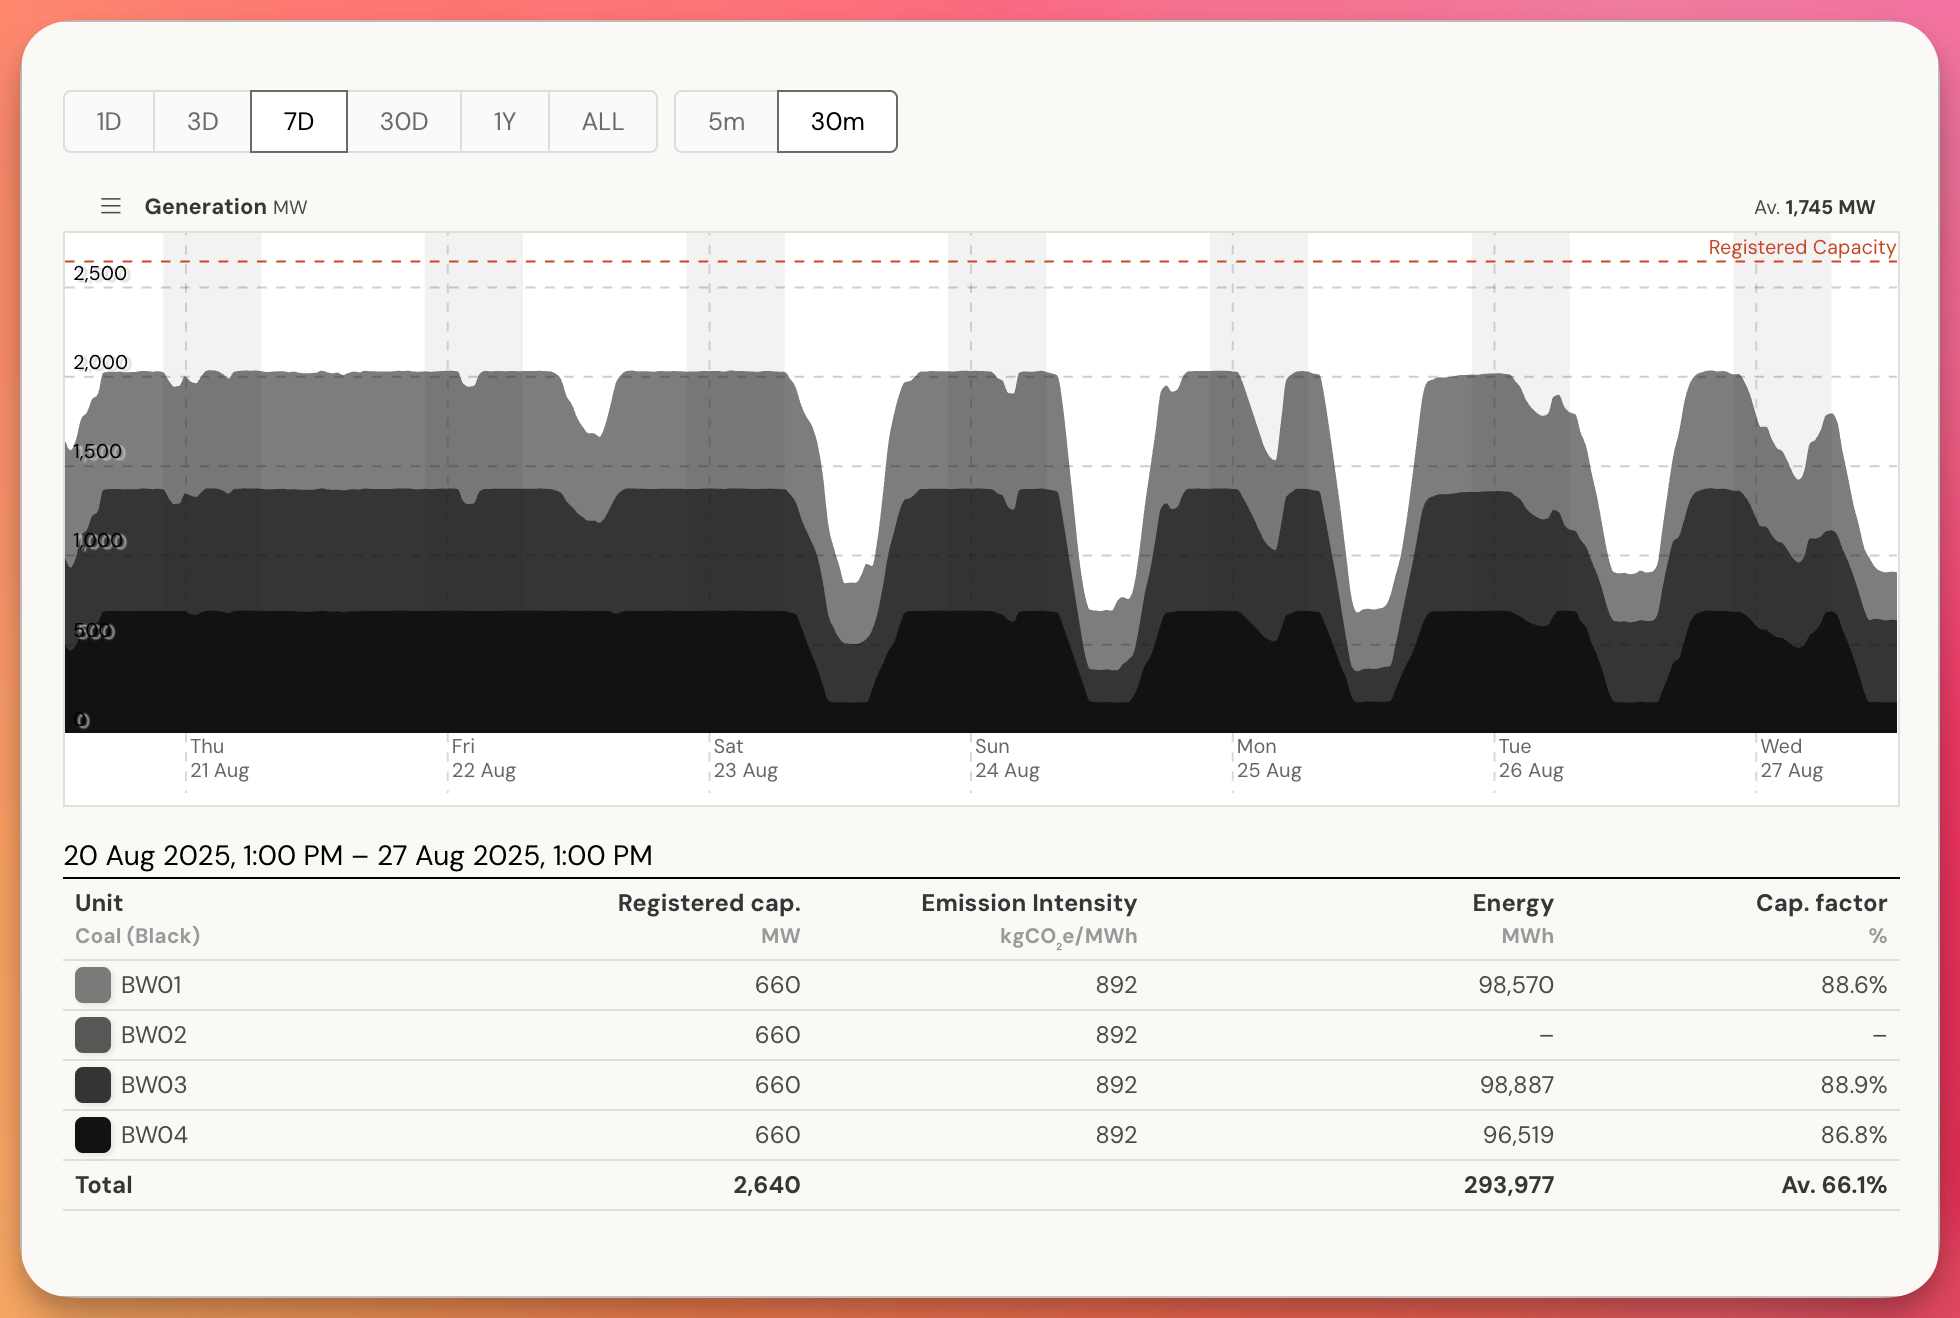
The facility page displays:
- Current maximum capacity for each generation unit
- Unit-level details including fuel technology
- Operational status and performance metrics
- Capacity factors for each unit
Open Electricity displays maximum capacity on facility pages and in capacity charts. This is the value AEMO uses for bid validation and reflects the actual upper bound on a unit’s output, rather than the nameplate figure registered at market entry. The registered value remains available through the API.
This is better demonstrated when viewing battery facilities, such as the Waratah Super Battery in New South Wales.
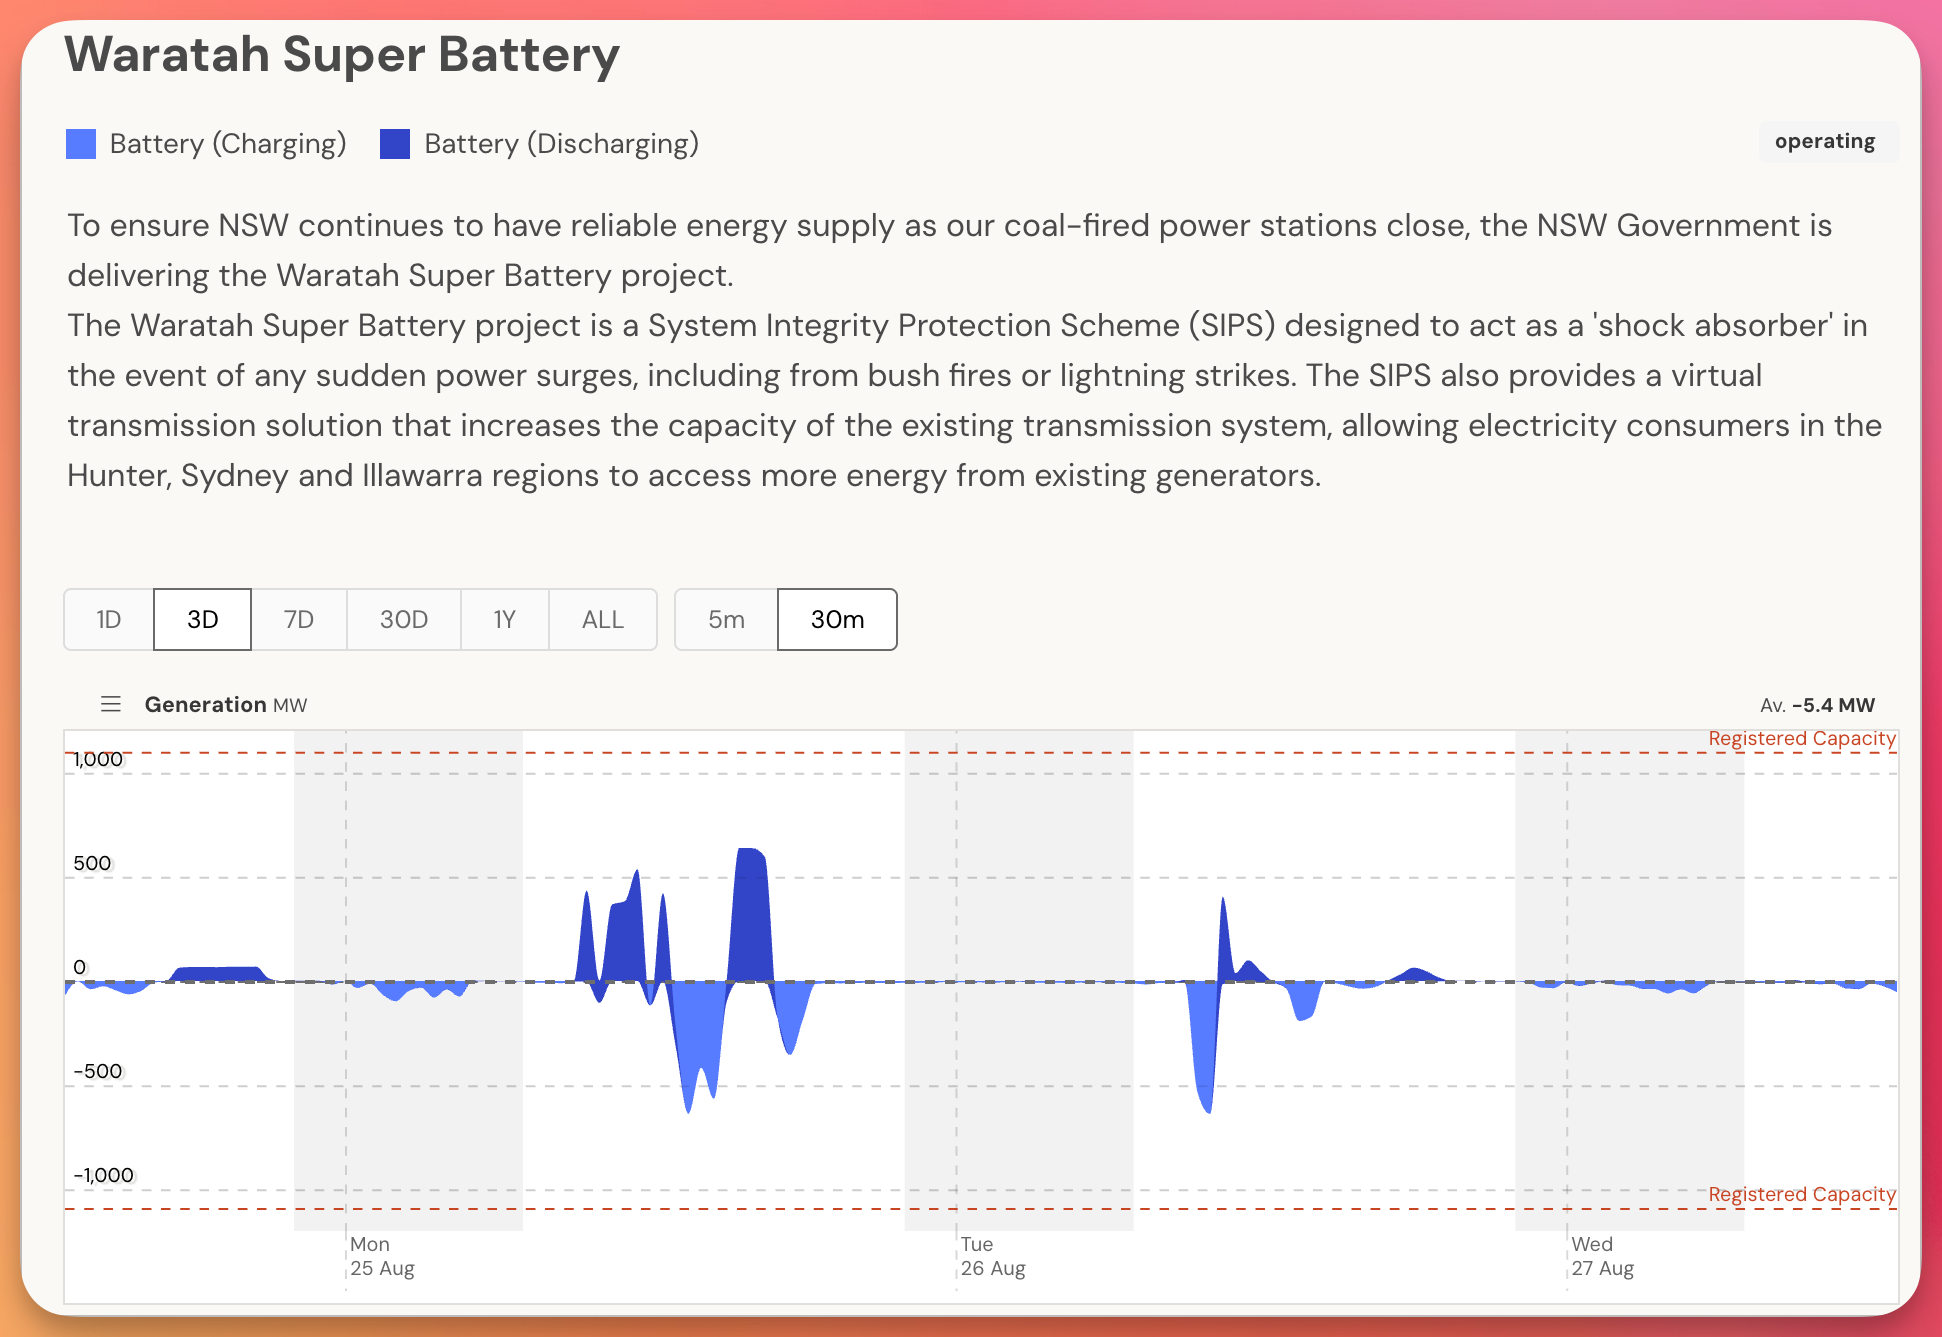
Generation tracks closely against the unit’s maximum capacity.
Capacity Charts
Open Electricity’s capacity charts provide comprehensive views of capacity across networks and fuel technologies:
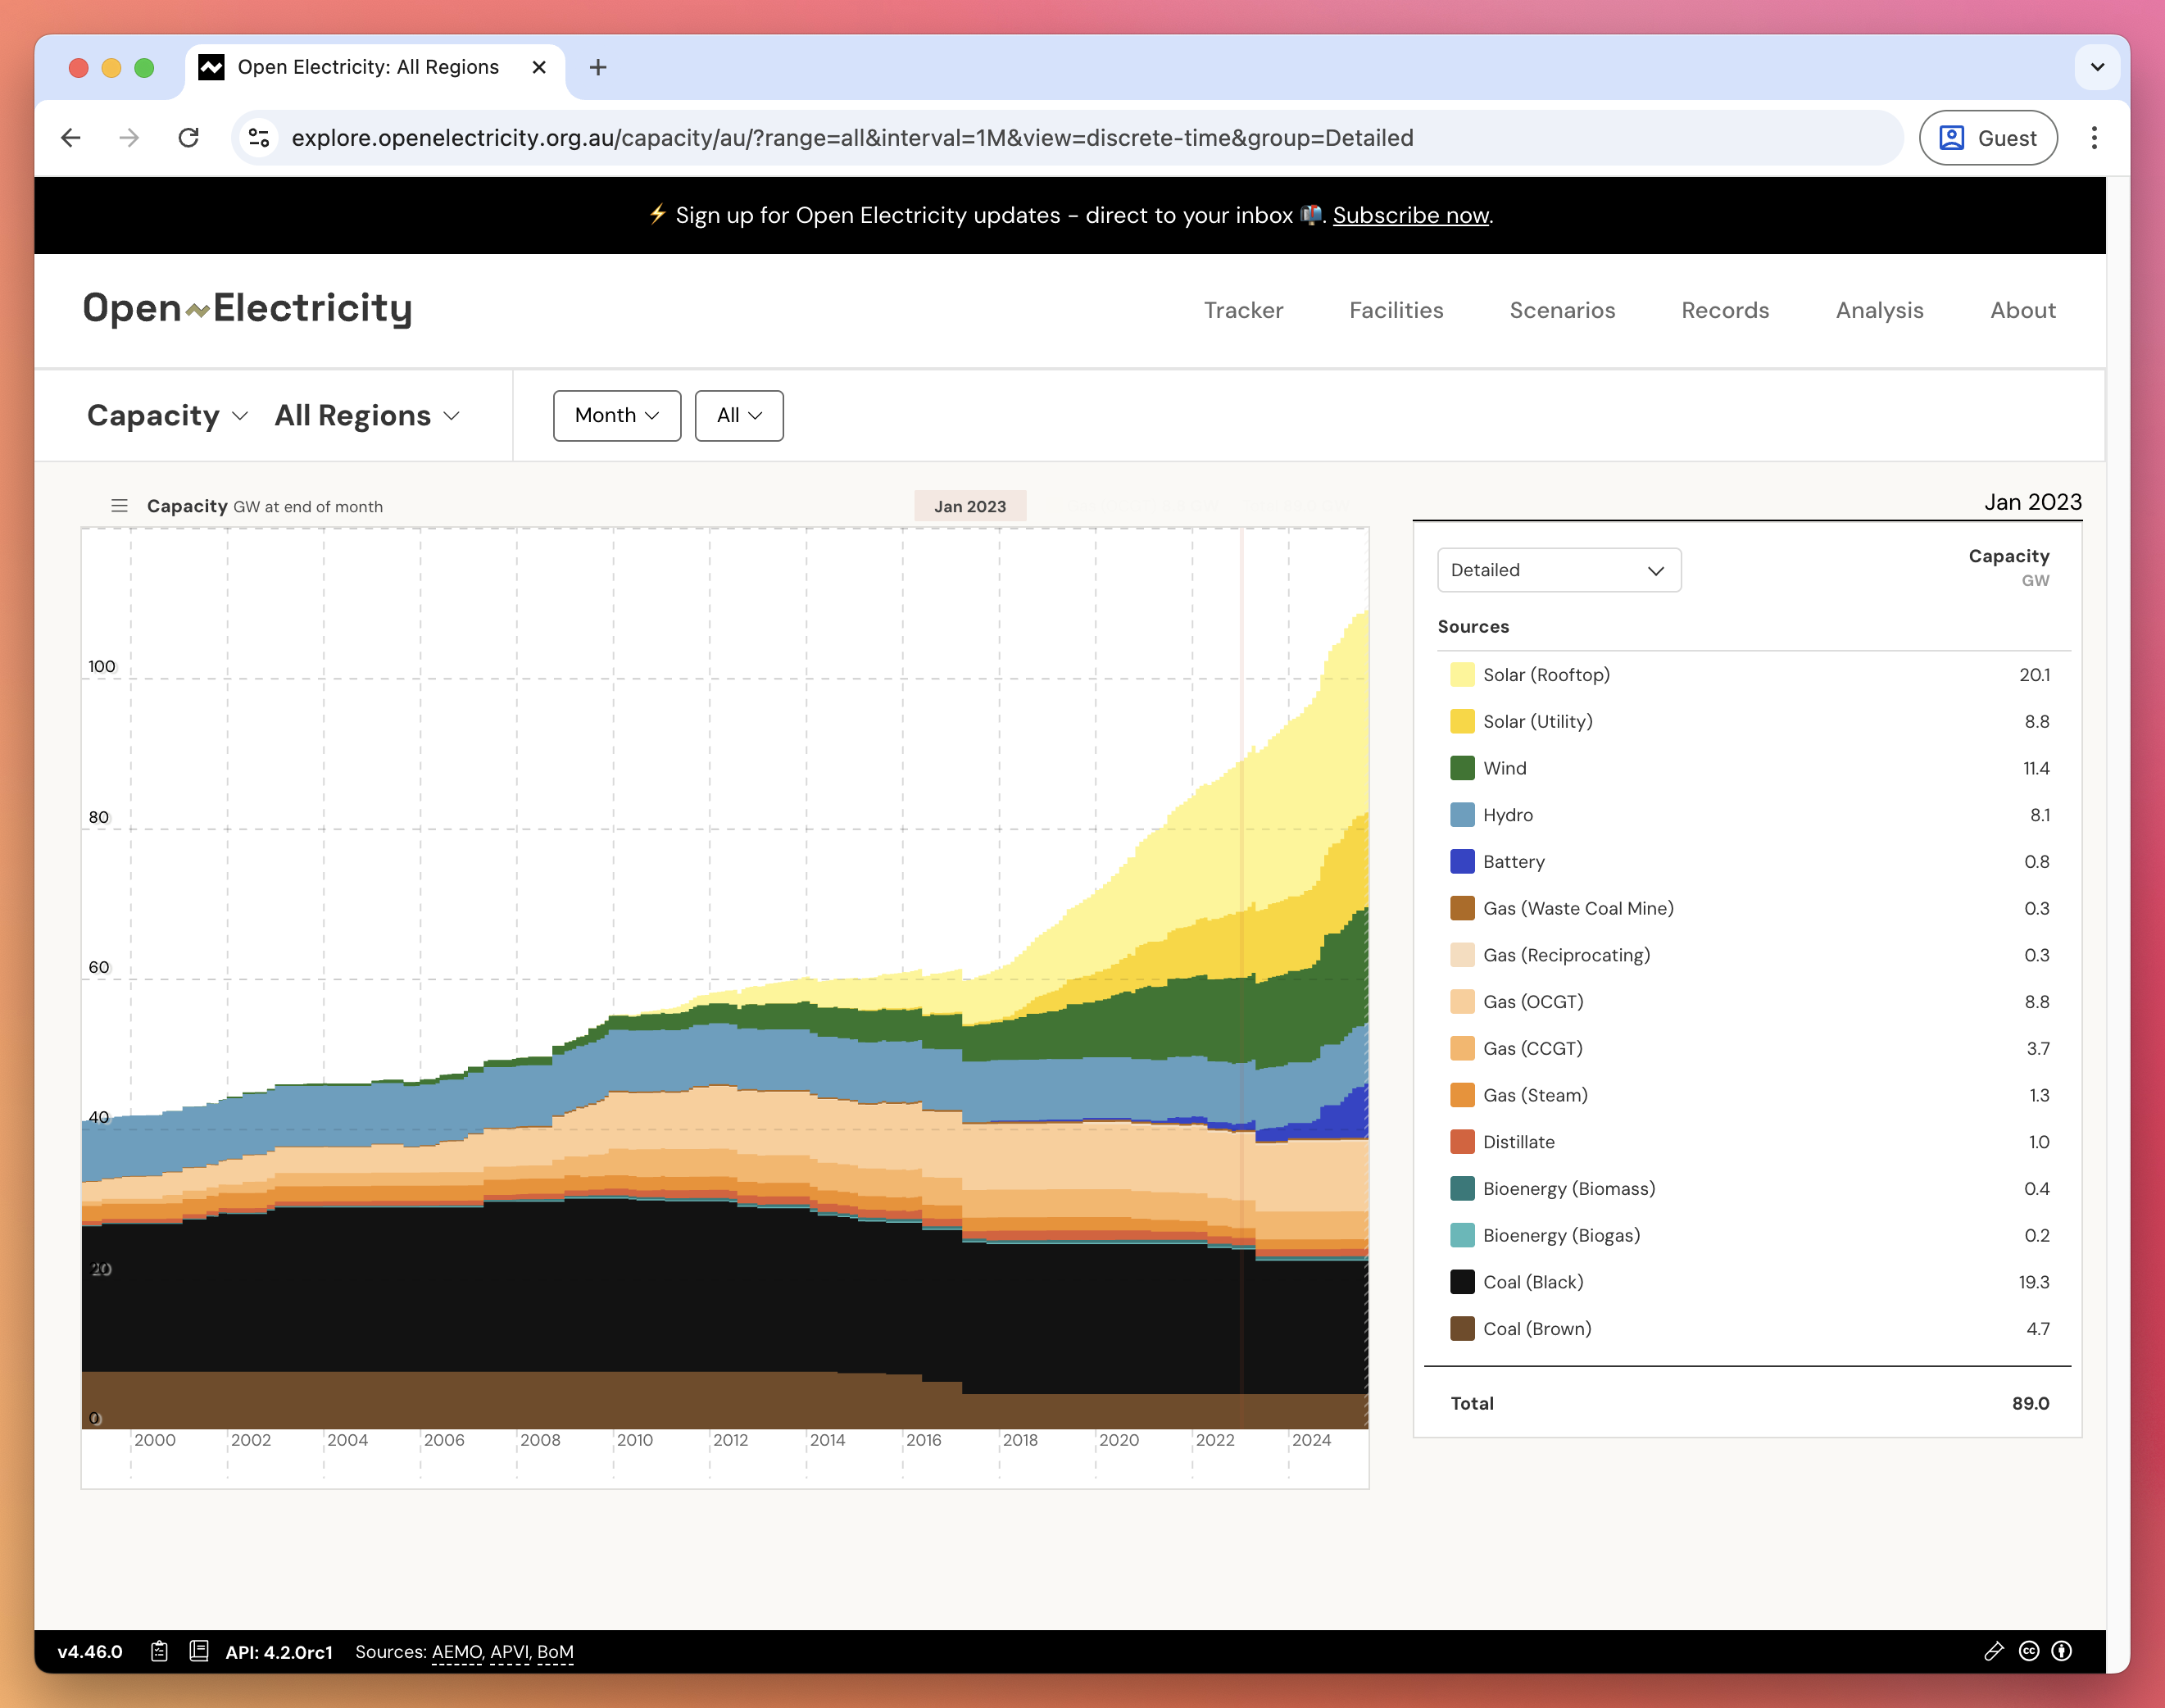
These advanced charts offer:
- Historical maximum-capacity trends by fuel technology
- Combined view of both NEM and WEM markets
- Interactive filtering and time range selection
- Breakdown by renewable and non-renewable sources
As with the facility pages, the aggregated fleet values are summed from each unit’s maximum capacity.
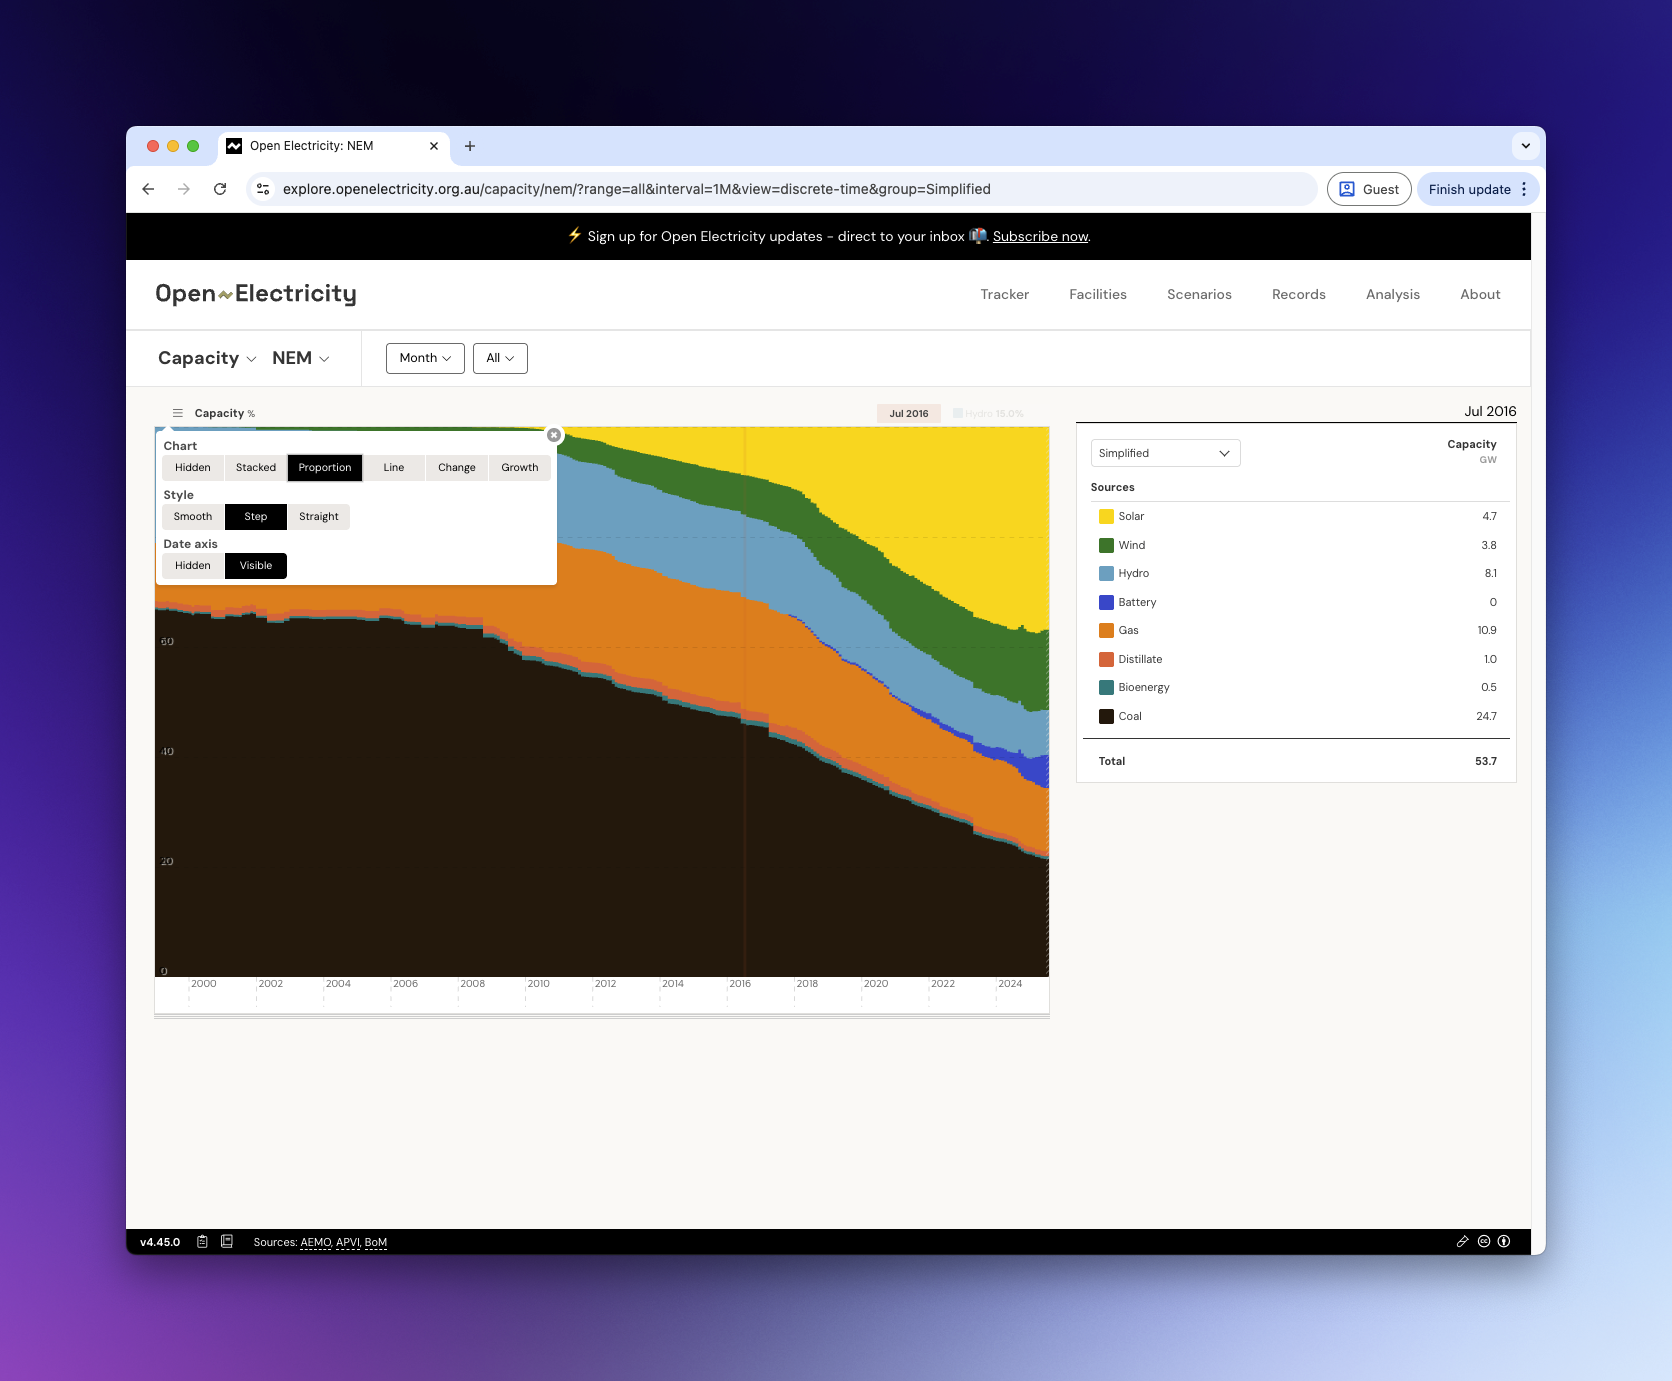
Advanced charting features allow you to view capacity history by fueltech over time in proportion view, change view, and more.
API Access
For programmatic access, capacity data is available through the Open Electricity API at the facilities endpoint. The API provides:
- Real-time capacity information
- Historical capacity data
- Both registered and maximum capacity values (web UI uses maximum)
- Detailed unit-level information
Capacity Factors
Capacity factor is a crucial metric that measures how much electricity a generator actually produces compared to what it could produce if operating at full capacity continuously. It’s expressed as a percentage:
Capacity Factor = (Actual Energy Output) ÷ (Maximum Possible Energy Output) × 100%
What Capacity Factors Tell You
A capacity factor reveals the operational characteristics and performance of a power station:
- High capacity factors (70-90%) indicate baseload generators that run continuously
- Moderate capacity factors (30-60%) suggest peaking plants or weather-dependent renewables
- Low capacity factors (10-30%) typically indicate backup generators or highly variable renewables
Typical Capacity Factors by Fuel Technology
Carbon-based
- Coal: 70-85% - Designed for continuous operation
- Gas: 10-70% - Combined cycle plants often run as mid-merit generation or as peaking plants
- Diesel: 0-10% - Used in emergency situations
Renewables
- Hydro: 30-50% - Varies significantly based on water availability and market needs
- Wind: 30-45% - Dependent on wind resource quality and location
- Solar (Utility): 25-35% - Limited by daylight hours and weather often better oriented and placed
- Solar (Rooftop): 15-20% - Lower than utility
Storage
- Battery: 10-30% - Used for arbitrage and grid stabilisation rather than continuous output
- Pumped Hydro: 20-40% - Cycles between generation and pumping modes
Interpreting Capacity Factors
Capacity factors help assess:
- Economic Performance: Higher capacity factors generally mean better return on investment
- Resource Quality: For renewables, higher factors indicate more optimal unit locations
- Operational Strategy: Low factors may be intentional for peaking plants
- Maintenance Patterns: Declining factors might indicate ageing equipment
- Market Conditions: Economic factors such as price spikes or surges in demand influence when generators operate
For more detailed facility information and real-time generation data, explore the Facilities Guide.