Curtailment
Understanding renewable energy curtailment in the NEM
What is Curtailment?
Curtailment occurs when renewable energy generators (wind and solar) are instructed to reduce their output below what they could potentially generate given the available wind and solar resources. This typically happens when there is more renewable generation available than the grid can accommodate at that moment.
Think of it like having a water tap that could flow at full pressure, but you’re only opening it halfway because your bucket would overflow otherwise. The renewable resources (wind and sunshine) are available, but the electricity isn’t needed or can’t be transported through the grid at that time.
Why Does Curtailment Happen?
Curtailment occurs for several reasons:
1. Oversupply of Generation / Low Spot Prices
When demand is low or moderate and renewable generation is plentiful, spot prices fall to low or even negative levels. If other generators can’t reduce output far enough, then renewable sources will also curtail. This form of curtailment – referred to as “self-curtailment” or “economic offloading” - is a normal feature of the NEM’s pricing mechanism, and the curtailed generators will be those who have offered their output at higher prices than their competitors. This type of curtailment often happens during:
- Sunny weekend afternoons when solar generation is high but demand is low
- Windy nights when wind generation peaks but overnight demand is minimal
2. Network Constraints
Transmission lines have capacity limits. Even if there’s demand elsewhere in the grid, renewable generators may need to curtail if the transmission lines are at capacity. This is particularly common in:
- Remote renewable energy zones with limited transmission capacity
- Areas with rapid renewable development that has outpaced transmission infrastructure
3. System Security
The grid operator (AEMO) may curtail generation to maintain system stability, including:
- Managing system strength and inertia requirements
- Maintaining frequency within safe limits
- Ensuring adequate reserves for unexpected events
How Open Electricity Reports Curtailment
Open Electricity calculates curtailment by comparing what renewable generators could have produced (unconstrained generation) with what they actually produced (actual generation). This data comes from AEMO’s dispatch data, which provides target values and unconstrained intermittent generation forecasts (UIGF) for wind and solar.
Open Electricity Website
Curtailment is displayed in the network generation views on the tracker of the Open Electricity website.
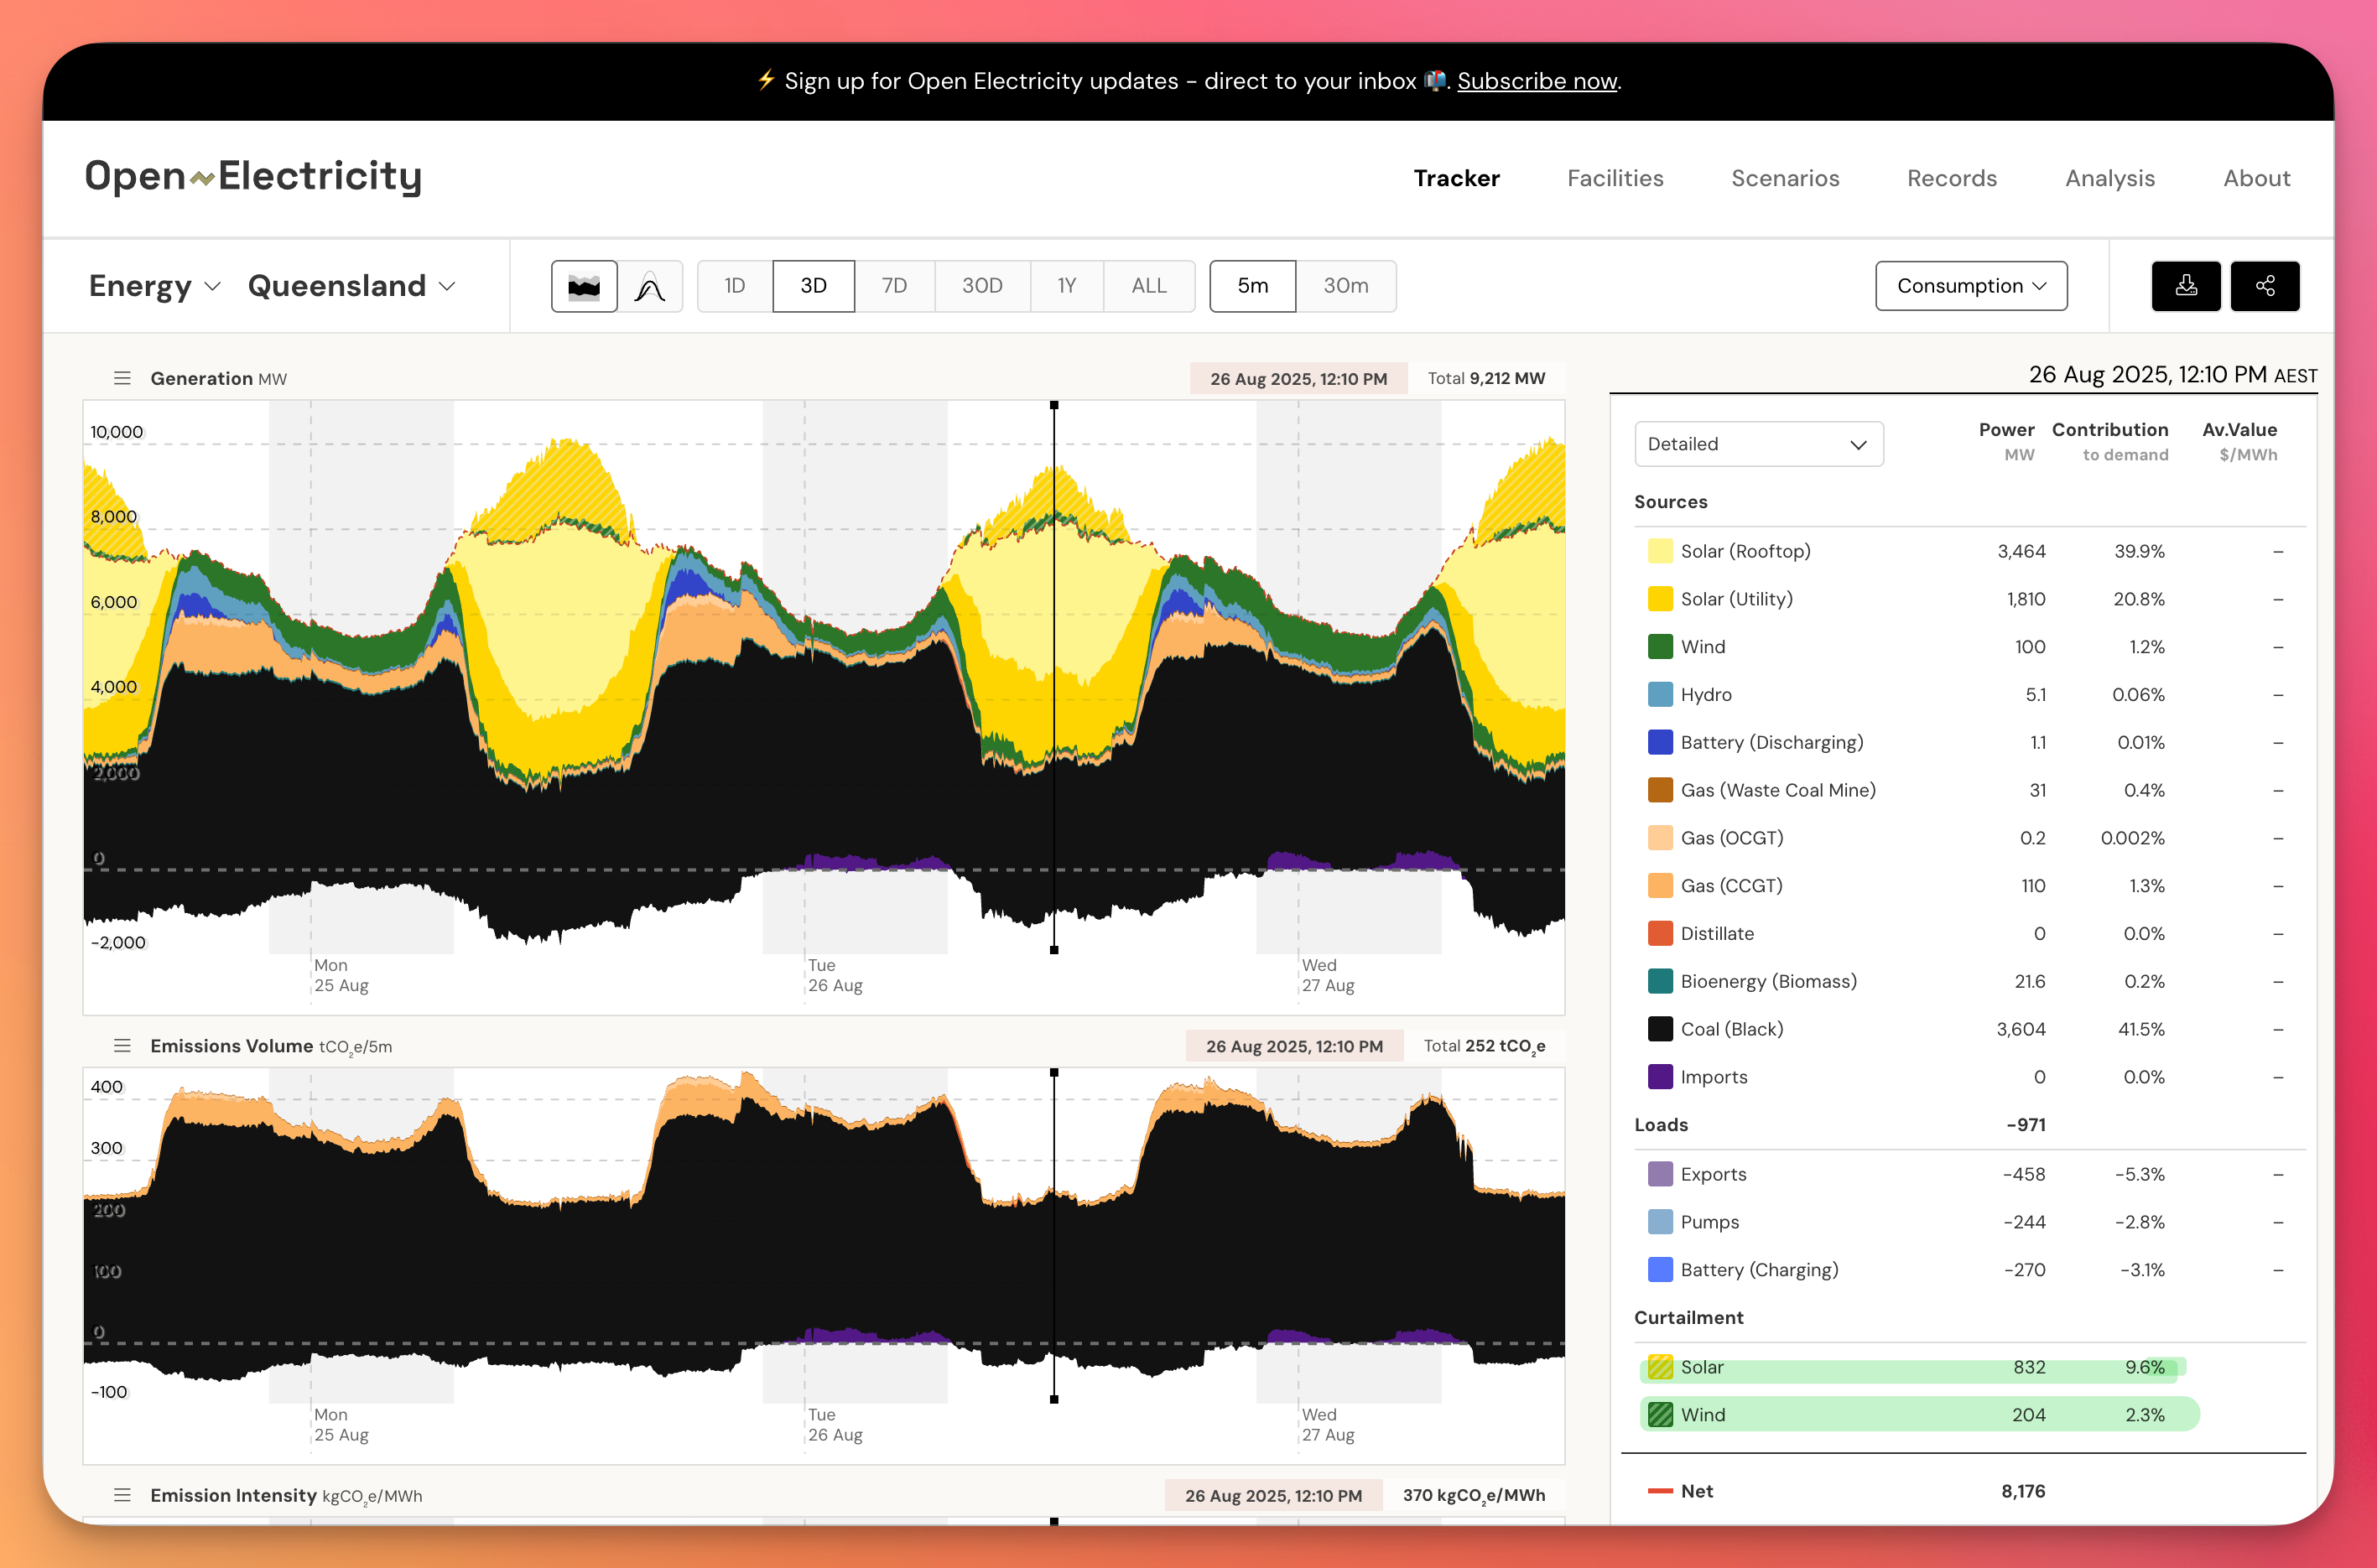
Each of wind and solar curtailment can be seen in the chart for both power and energy views, and are accounted for in the table on the right.
Available Metrics
Open Electricity provides curtailment data through several metrics:
Power Metrics (MW)
curtailment- Total curtailed power across all renewable sourcescurtailment_solar_utility- Utility solar generation curtailedcurtailment_wind- Wind generation curtailed
These show the instantaneous power that could have been generated but wasn’t, measured in megawatts (MW). Use these for:
- Real-time monitoring
- Understanding current grid conditions
- 5-minute and hourly interval analysis
Energy Metrics (MWh)
curtailment_energy- Total curtailed energy over a time periodcurtailment_solar_utility_energy- Utility solar energy curtailedcurtailment_wind_energy- Wind energy curtailed
These show the cumulative energy that was curtailed over time, measured in megawatt-hours (MWh). Use these for:
- Daily, weekly, or monthly summaries
- Understanding total renewable energy lost
- Economic impact analysis
Understanding AEMO’s Timestamp Convention
AEMO uses an “interval-ending” timestamp convention where timestamps represent the end of each 5-minute dispatch interval. For example, a timestamp of 14:35 represents the period from 14:30 to 14:35.
AEMO’s dispatch data contains two fundamentally different types of measurements that occur at different points in time:
- SCADA Actual Generation (
INITIALMW): These are snapshot measurements taken at the beginning of each dispatch interval. For the interval timestamped 14:35, the SCADA reading was actually taken at 14:30. - Dispatch Targets (
CLEAREDMW): These are forward-looking targets set at the beginning of an interval for generators to achieve by the end of that interval. For the interval timestamped 14:35, these targets were set at 14:30 to be achieved by 14:35.
The difference is most evident when dealing with aligning curtailment with actual generation.
Open Electricity Solution to Timestamp Alignment
Curtailment is calculated as the difference between what generators could produce (UIGF - Unconstrained Intermittent Generation Forecast)
and what they were dispatched to produce (CLEAREDMW). Both UIGF and CLEAREDMW are targets for the end of the interval.
To properly align curtailment with actual generation:
- Actual generation for interval 14:35 (measured at 14:30)
- Must be compared with curtailment targets from interval 14:30 (which were targets set at 14:25 for achievement by 14:30)
This requires shifting the curtailment data forward by one interval (5 minutes) so that:
- The curtailment target that was set for time point T
- Aligns with the actual generation measured at time point T
Implementation
Open Electricity addresses this by storing curtailment fields with a timestamp shifted forward by 5 minutes from their source dispatch data. interval. This ensures that when you view data for any given timestamp, you’re seeing:
- The actual generation that occurred at that moment
- The curtailment that was targeting that same moment
This alignment is critical for accurate analysis of renewable energy curtailment patterns and their relationship to actual generation output.
Understanding Curtailment Patterns
Daily Patterns
Solar curtailment typically peaks during midday hours when solar generation is highest, particularly on mild, sunny days when air conditioning demand is low. Wind curtailment can occur at any time but is often higher during overnight periods when demand is lowest.
Seasonal Patterns
- Spring: Often sees the highest curtailment due to mild weather (low demand) combined with good renewable conditions
- Summer: High solar generation but also high cooling demand can lead to midday curtailment
- Winter: Lower solar generation but wind curtailment may increase during storms
- Autumn: Similar to spring with moderate curtailment levels
Price Correlation
Curtailment typically correlates with low or negative electricity prices. When renewable generation is curtailed, it often indicates an oversupply situation that drives prices down. Understanding this relationship helps explain:
- Why negative prices occur
- The economic impact on renewable generators
- Investment signals for storage and transmission
Impact and Implications
Economic Impact
Curtailed energy represents lost revenue for renewable generators and lost clean energy for the grid. As renewable penetration increases, curtailment is expected to grow unless addressed through:
- Energy storage: Batteries can store excess renewable generation
- Transmission expansion: Better connections between renewable zones and demand centers
- Demand response: Shifting demand to periods of high renewable generation
- Hydrogen production: Using excess renewables for green hydrogen
Environmental Impact
Every MWh of curtailed renewable energy is clean energy that could have displaced fossil fuel generation. Reducing curtailment is key to maximizing emissions reductions from renewable investments.
Market Signals
High curtailment levels signal:
- Opportunities for energy storage investment
- Need for transmission infrastructure upgrades
- Potential for new flexible demand (like hydrogen electrolyzers)
- Locations where new renewable investment may face challenges
Data Sources
Open Electricity calculates curtailment using AEMO’s official dispatch data:
- DISPATCHREGIONSUM table provides regional target and unconstrained generation values
- Semi-scheduled generator data includes wind and solar farm constraints
- Updates every 5 minutes with NEM dispatch intervals
The calculation methodology:
- Unconstrained Generation (UIGF): What could have been generated based on available resources
- Actual Generation: What was actually generated (cleared MW)
- Curtailment: The difference between potential and actual generation
This approach provides a comprehensive view of renewable curtailment across the NEM, helping stakeholders understand and respond to the challenges and opportunities of renewable integration.
Further Reading
- AEMO’s Quarterly Energy Dynamics reports include detailed curtailment analysis
- Renewable Integration Study examines future curtailment scenarios
- Semi-Scheduled Generation explains how renewable generators participate in the NEM