Demand in Electricity Networks
Overview
Demand is how much electricity is being pulled from the grid at any moment, measured in megawatts (MW). Over time, it becomes energy, measured in megawatt-hours (MWh).
Everything plugged in contributes: factories, trains, streetlights, air conditioners, your kettle. Add it all up across a region and that’s the demand number AEMO has to match with generation.
Daily shape
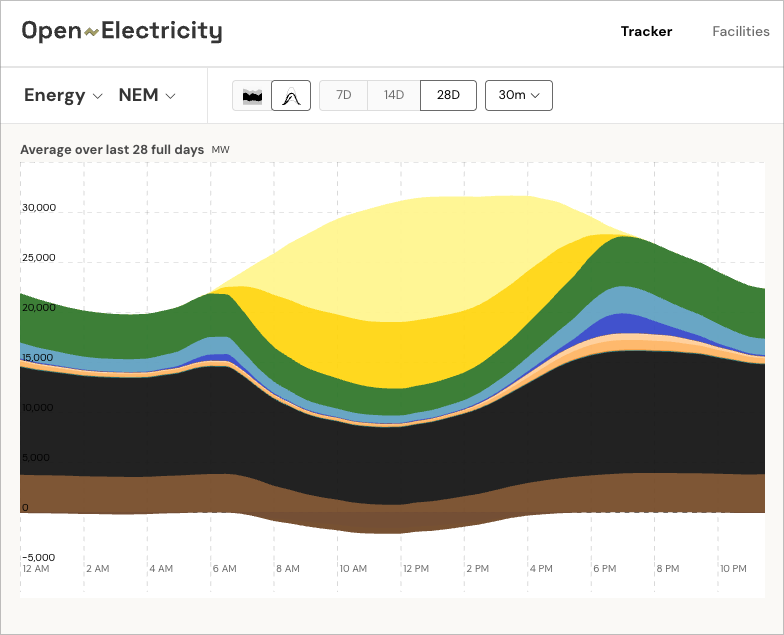
Demand has a pretty consistent daily shape. It’s lowest overnight when most people are asleep and businesses are shut. Morning brings a ramp as the country wakes up. Then around midday, something interesting happens: rooftop solar kicks in hard, and the demand that centralised power stations have to meet drops into a trough. This is the duck curve you’ll see referenced in energy commentary and pictured above on Open Electricity.
At sunset, solar output falls off a cliff, but people are arriving home, cooking, running heaters or AC. The grid has to ramp conventional generators fast to cover that gap. It’s the steepest climb of the day and the period most likely to cause problems.
Seasons
Summer heatwaves drive the absolute peaks, mostly from air conditioning. Winter heating pushes demand up too, especially in Victoria and Tasmania. Spring and autumn tend to be quieter.
Why it matters
AEMO dispatches generation to match demand every five minutes. If generation falls short, you get load shedding (rolling blackouts). If there’s too much, frequency drifts and the system becomes unstable. Either way, bad.
Rooftop Solar and Home Batteries
Rooftop solar and home batteries have made demand harder to measure. A house with panels running the air conditioner at midday might draw nothing from the grid, so from AEMO’s perspective that demand doesn’t exist. But the person is still consuming electricity. It’s just being met behind the meter, invisible to the dispatch engine.
As more rooftop solar gets installed, and more home batteries rolled out, the gap between what Open Electricity can see (scheduled demand) and what’s actually being consumed (underlying demand) keeps widening, especially during the the day.
Demand Metrics in Open Electricity
Open Electricity sources demand from AEMO’s DISPATCHREGIONSUM table:
| Metric | AEMO Source Field | Description |
|---|---|---|
demand | TOTALDEMAND | Scheduled demand, met by scheduled + semi-scheduled generation and interconnector flows |
demand_energy | Calculated | Energy derived from demand over the interval (MWh) |
Scheduled vs operational vs underlying demand
“Demand” means different things depending on how much generation you can see:
-
Scheduled demand (
TOTALDEMAND) is what NEMDE dispatches against. It only includes load visible to the dispatch engine: large industrial consumers and distribution network load as seen at transmission connection points. This is the demand figure Open Electricity uses. -
Operational demand (
DEMAND_AND_NONSCHEDGEN) adds non-scheduled generation that AEMO has telemetry for (smaller wind and solar farms). It’s the total demand being met by all grid-connected generation AEMO can observe. -
Underlying (or native) demand adds embedded generation that AEMO can’t see, mostly rooftop solar. This is the closest measure to true total consumption, including load being met behind the meter.
The gap between scheduled and underlying demand has grown as more rooftop solar gets installed. During midday in sunny states, the difference can be substantial.
How AEMO calculates TOTALDEMAND
AEMO calculates TOTALDEMAND per region per 5-minute dispatch interval. It combines two inputs:
INITIALSUPPLY— measured generation output from scheduled and semi-scheduled generators in the region, adjusted for interconnector flows- A forecast adjustment to account for time lag between physical metering and dispatch
Roughly:
So TOTALDEMAND is a near-real-time estimate of the demand being served by scheduled generation and interconnectors. It doesn’t include demand met by non-scheduled generators or behind-the-meter generation like rooftop solar.
For the full technical spec, see AEMO’s Demand Terms in EMMS Data Model.
NEM vs WEM Demand
NEM
The NEM provides demand directly via DISPATCHREGIONSUM at 5-minute resolution. Open Electricity uses TOTALDEMAND from this source.
WEM
The WEM is trickier. Its public data sources (referenceTradingPrices) only publish prices, not demand. The balancing_summary table has price but demand and generation_total are NULL.
Since the WEM is an isolated grid with no interconnectors, demand roughly equals total generation. Open Electricity derives WEM demand by summing generation from all WEM facilities in the facility_scada table.
Demand response
Demand response (DR) programs pay consumers to reduce consumption during peak periods or high-price events. Since TOTALDEMAND is derived from INITIALSUPPLY (actual generation output), it already reflects demand after DR has taken effect. When DR kicks in, consumption drops, less generation gets dispatched, and TOTALDEMAND falls with it.
Wholesale Demand Response (WDR)
Since October 2021, AEMO’s Wholesale Demand Response Mechanism lets aggregators bid load reductions directly into NEM dispatch. DR providers submit availability and price bids just like generators, and when dispatched, the load reduction shows up as reduced TOTALDEMAND.
Open Electricity doesn’t distinguish between organic consumption changes and DR-driven reductions. A drop in TOTALDEMAND could be people using less electricity, DR activation, or both.
For more on demand measurement, see the WattClarity demand explainer and AEMO Operational Demand Data.
Accessing demand data
Demand data is available via the market endpoint:
POST /v4/market/network/{network_code}
Available demand metrics: demand, demand_energy
from openelectricity import OEClient
from openelectricity.types import MarketMetric
from datetime import datetime, timedelta

with OEClient() as client:
    response = client.get_market(
        network_code="NEM",
        metrics=[MarketMetric.DEMAND, MarketMetric.DEMAND_ENERGY],
        interval="5m",
        date_start=datetime.now() - timedelta(days=1),
        primary_grouping="network_region"
    )

    for timeseries in response.data:
        print(f"Metric: {timeseries.metric} ({timeseries.unit})")
        for result in timeseries.results:
print(f" {result.name}: {len(result.data)} intervals")import { OpenElectricityClient } from "openelectricity"
const client = new OpenElectricityClient()
const { datatable } = await client.getMarket("NEM", ["demand", "demand_energy"], {
interval: "5m",
dateStart: "2024-01-01T00:00:00",
dateEnd: "2024-01-02T00:00:00",
primaryGrouping: "network_region",
})Data intervals
| Network | Interval | Source |
|---|---|---|
| NEM | 5 min | AEMO DISPATCHREGIONSUM (TOTALDEMAND) |
| WEM | 30 min | Derived from facility_scada generation totals |